Long-run crop value versus fertiliser affordability.
Explore curated views from ADM’s Fertiliser Affordability Tracker, analysing feed wheat and oilseed rape values relative to delivered UK fertiliser prices. These charts are designed to help put current market levels into context and support more informed purchasing decisions.
Selected market views
A curated set of high-value charts exported from the tracker, designed to show long-run crop-relative fertiliser affordability, historic range positioning, programme cost burden and relative value relationships across key nutrient groups.
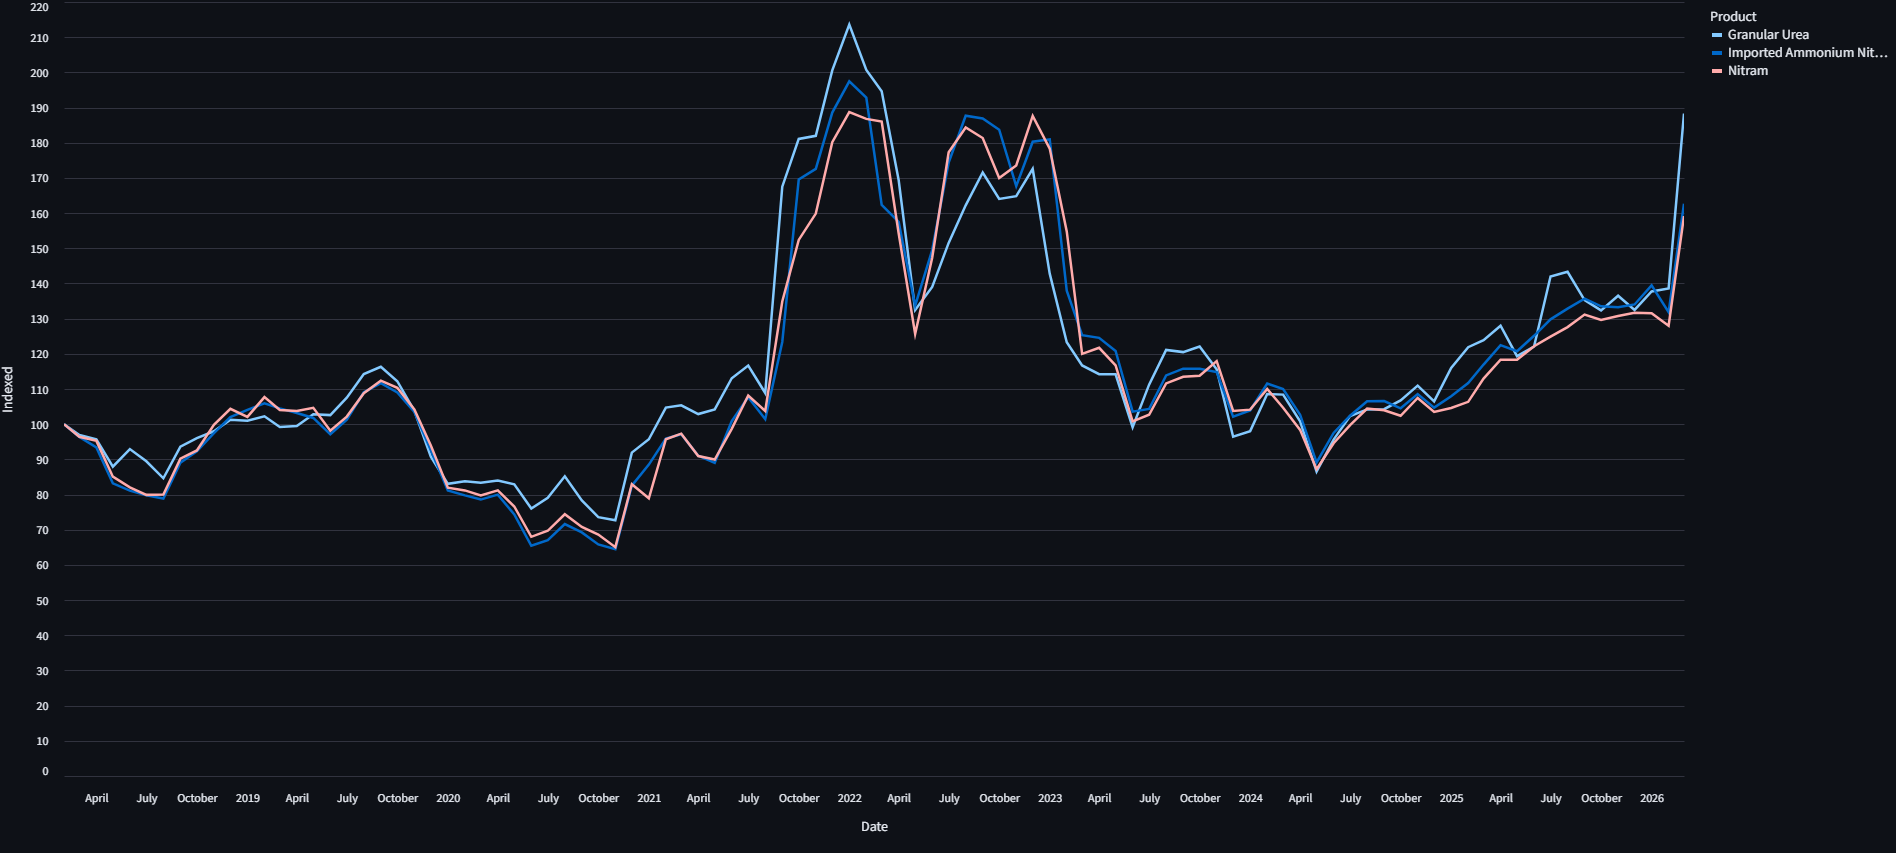
Feed Wheat versus nitrogen affordability
Long-run indexed comparison showing how delivered UK nitrogen values have moved relative to feed wheat over time. Values are normalised to 100 from February 2018.
OSR versus DAP historic percentile
Shows where current phosphate affordability sits versus the long-run observed range. For example a value of 0.8 means the current ratio is higher than 80% of past observations in that same selected series.

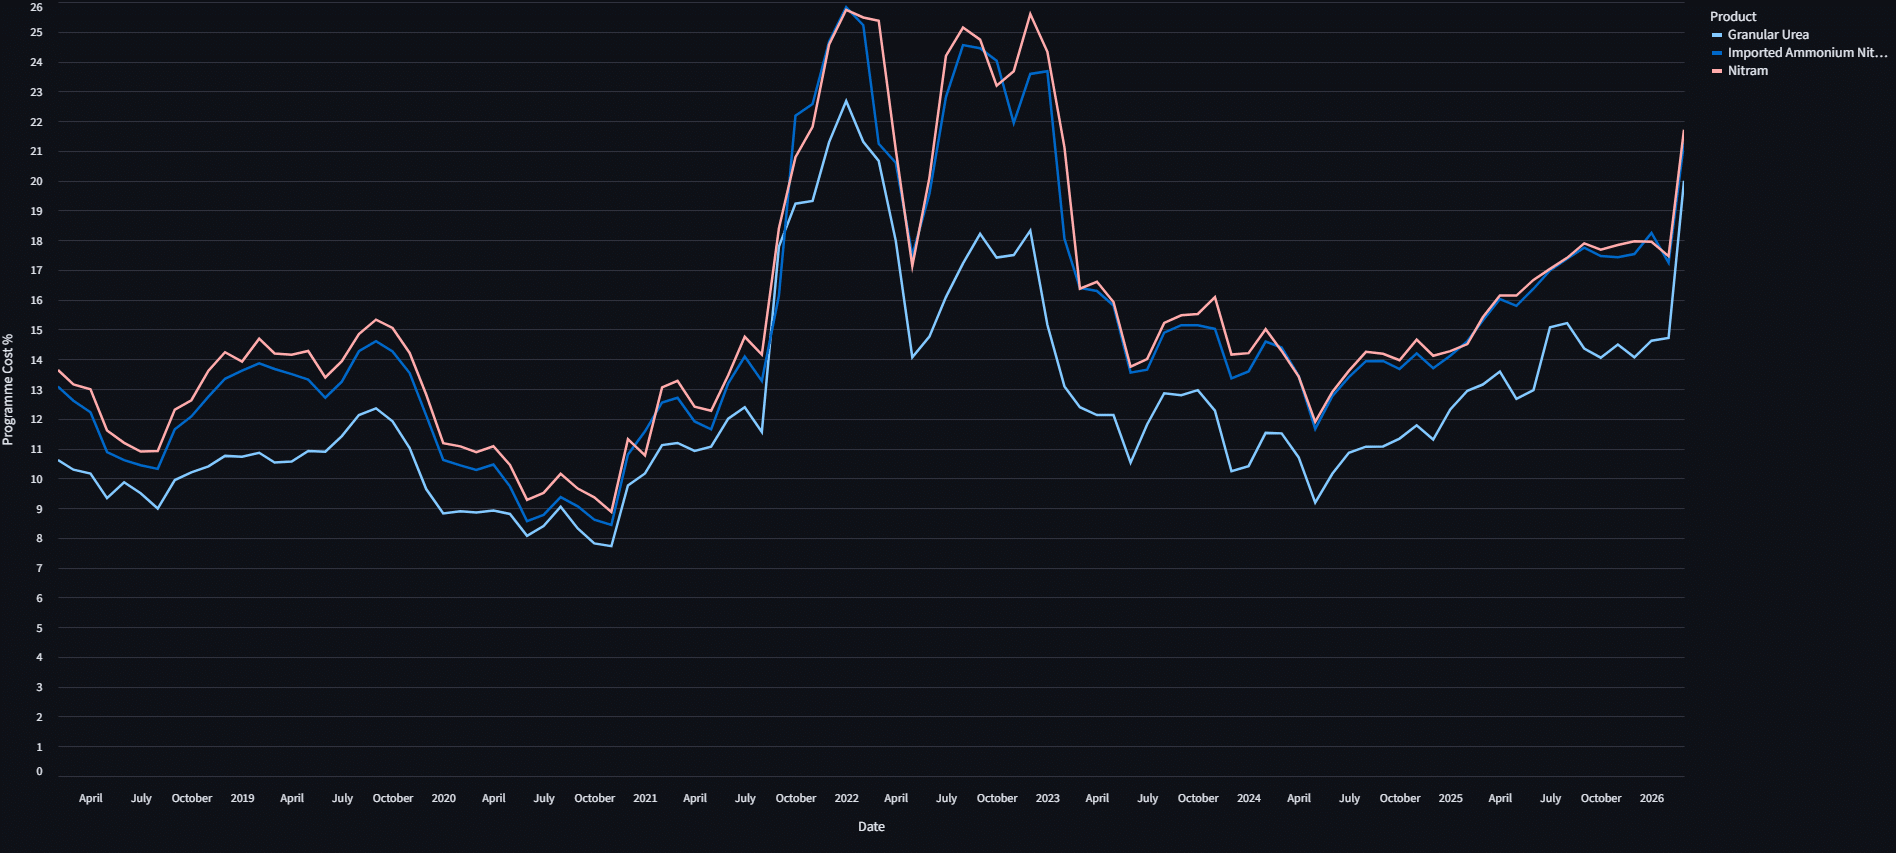
Programme cost burden versus crop value
Estimated Nitrogen cost as a percentage of crop revenue through time.
OSR relative affordability index versus Straights
Tracks the change in straights (DAP,TSP,MOP) affordability relative to oilseed rape from the base period.

Feed Wheat relative value z-score
Standardised view of whether current affordability sits rich or cheap versus history.

OSR Crop Price versus Nitrogen Price
Nitrogen price divided by the crop price on the same date. Values above 1 indicate the fertiliser is more expensive per tonne than the crop.

What this analysis shows
The tracker is designed to move beyond flat price and help place the market into commercial context.
Relative affordability
Compares fertiliser prices against crop values rather than looking only at outright market levels.
Historic context
Uses long-run indexed views, percentiles and z-scores to show whether markets are relative to historic values. Reference point for Feed Wheat is 8.5mt / ha Yield & 220kg of N applied / ha. Reference point for Oilseed Rape is 3.5mt /ha Yield & 180kg of N applied / ha.
Decision support
Helps growers and farm businesses assess timing, relative value and affordability as markets evolve.
Need a specific dataset or market view?
If there is a particular comparison, crop view, region or affordability measure you would like included in future updates, please contact Nico Papworth.
Market Comment
Fertiliser affordability has improved against both UK ex-farm feed wheat and oilseed rape, with the latest ADM affordability charts showing a clear retracement from the spring highs. On a feed wheat programme-cost basis, granular urea has moved from around 21.3% of crop value at the recent peak to approximately 17.3%. Imported AN has moved from roughly 23.6% to 19.6%, while Nitram has eased from around 23.5% to 20.5%. Against oilseed rape, the same pattern is visible. The nitrogen ratio for granular urea has fallen from approximately 1.46 to 1.17, while imported AN has moved from around 1.21 to 1.00 and Nitram from around 1.21 to 1.04. Urea has led the correction, supported by weaker global values, limited buying interest, India’s latest tender acceptances of just over 1.8 million tonnes, and renewed pressure from potential Chinese export availability. However, this is an improvement in affordability, not a full reset. Nitrates remain stickier, supported by ammonia, gas, European production costs and producer margin aspirations. Phosphates remain the clearest area of structural tightness. DAP and TSP continue to screen historically expensive, while MOP looks comparatively better value. Against OSR, DAP and TSP remain indexed around 130, compared with MOP closer to 91.